
Understanding of the Japanese animation industry has developed a lot in English-speaking circles. However, while in-depth records or detailed anecdotes about specific productions have become easier to find, a general overview of the industry as a whole is still missing. This series doesn’t aim to provide something half as ambitious, but hopes to provide some of the resources necessary to advance in that direction.
The goal of this series, then, is to offer a quantitative perspective on the anime industry, sharing some of the numbers and data that are available in Japanese, but not in English. Numbers are not absolute, and neither are they the key to a final, “objective” approach of the anime industry. But they can help us obtain a distance and perspective that the usual, qualitative approach does not, or rarely, have. Each entry in this series will therefore use different sources, on a variety of topics related to the anime industry, in the hopes of clarifying and improving our overall knowledge of it.
The first entry in this series, dedicated to the overall number of anime being made, is available here. The second one, dedicated to anime studios, is available here.
Like our content? Feel free to support us on Ko-Fi!
When denouncing the way the anime industry (or any industry) functions, the expression that most often comes up is that of “poor working conditions”. “Working conditions” is a vague term encompassing multiple things, not all of which can be embraced by statistics – from salary to subjective well-being, working hours and the tools being used. This conclusive piece will therefore not provide a general overview of this issue. It will even less do so considering the data sets used, each of which will be discussed in more detail. In any case, we now move on from the general situation of the industry to more concrete cases, which remains in itself valuable.
As the two previous pieces in this series, let us start by the question “how many?” – in this case, how many people are there in the anime industry? There exists, to my knowledge, no definite answer to this, but there is a 2020 survey providing an estimate of the number of animators currently active in Japan. These numbers remain approximative because of the way they were collected, by using the Japanese Anime Staff Database – which is useful, but not complete: out of the 196 TV works recorded there for 2019, they had access to the credits of only 114. Still, I believe we can take the numbers with a margin of more-or-less 10%. The final results were:
– Total number of genga and dai-ni genga credits: 25268
– Number of credited artists after removing duplicates: 5247
– Total number of production assistance credits: 1478
– Number of credited production assistants after removing duplicates: 964
Given that we have the number of minutes of animation aired on TV, it would be possible and indeed tempting to estimate how many minutes of animation each animator produces on average each year. You are free to make that calculation yourself, but the results wouldn’t be very indicative, since the survey includes in its count of “key animators” those in charge of second key animation – making it hard to properly figure how much “new”, “original” drawings are made.
The same method was applied to in-betweeners, but the results here are far more inconclusive, since in-betweeners are most often uncredited: the final number was of only 1854 people. What is interesting, however, is what the survey author does from here: separating foreign and Japanese artists and companies, it goes on to calculate how much animation is produced in Japan and how much overseas. I’ll spare you the details of the calculation, and it’s important to bear in mind that these numbers are very approximate, but the conclusion is that, for the 93 productions taken as a sample in 2019, only 33% of the in-betweens could have been produced in Japan – making the lack of sustainability of the Japanese industry quite clear.
Now, let us move on to more details about Japanese staff. The data this time comes from surveys conducted by the JANICA between 2005 and 2019. It is important to note two things beforehand:
1) It is not representative of the entire industry – the number of respondents goes from 83 in 2005 to 759 in 2015
2) Although the information remains animator-centered – in 2019, around half of the respondents were key animators – the results blend together multiple very different statuses, from series directors to coloring artists and 3D animators.
Anyways, let us start by getting a general idea of the profile of the respondents. An issue that is generally raised regarding animators in Japan is age – less young people are said to join the industry. Comparing the results of the 4 surveys over time, it is difficult to reach a definite conclusion: yes, the mean age of respondents in 2019 is significantly higher than in 2005, but this is not a continuous trend, as the 2009 numbers go down rather than up. But it is true that, if we count out 2009, the mean age of respondents keeps going up. These results are partly collaborated by the fact that the overall experience in the industry of the respondents is also rising, although far more irregularly.

Mean age and years of experience of survey respondents through time
Now, let us move on to animators’ statuses. Simplifying a bit, there are three main statuses for animators: in-house, permanently and exclusively attached to a single studio; on-contract, temporarily attached to a studio (sometimes exclusively, sometimes not), most of the time for the length of a production; freelance, unattached to any structure. The JANICA survey refines this, by adding statuses such as “self-employed” or part-time. A comparison of the 2015 and 2019 surveys provides surprising results: freelancers have always been the majority, but their proportion has moved from 37 to 50%. On the other hand, the proportion of on-contract workers has decreased while that of in-house workers has remained consistent.


It is however difficult to take any definite conclusion away from these numbers, because we don’t know if the 2015 and 2019 respondents are the same people. If they are, then we could conclude to a definite rise of freelancer labor, but it’d be harder to make the same conclusion if they aren’t. However, there is another trend that seems remarkable: it is that of more people working from home in 2019 than in 2015, as shown by the chart below. The pandemic can’t be to blame here, and the gap between both surveys is wide enough for the conclusion to be somewhat assured. The possible factors, then, would be the rise of freelance work and studios’ lowering ability to accommodate people in their facilities – perhaps indicating a trend of studios becoming smaller and smaller.


Now, let’s move on to the last topic, perhaps the one that most people think of when mentioning “working conditions”: salary and working hours. For salaries, the numbers of the 2019 survey are as follows:
– Yearly mean wage of 4,48 million yen
– Yearly median wage of 3,7 million yen
These numbers need to be put in a double perspective:
– Compared with the mean and median wage in Japan overall. In 2019, the yearly mean wage was of roughly 4,8 million, so only slightly higher than that of animators; however, in Tokyo, it seems that the mean wage in 2019 was of 6,2 million yen – that is, much higher than that of animation workers living in the capital.
– Compared with other numbers through time. The numbers provided by the different surveys aren’t complete, but from 2009 to 2019, there is a clear rise in the yearly mean wage.
In fact, just as salaries seem to have risen, the number of working hours has decreased, as can be seen from the chart below – though their numbers are extremely high in the first place.

Mean number of working hours in a day & days of rest per month of respondents through time
But once again, we need to be careful of where the data is coming from – is it the same people who have been working less, or just that the respondents in 2019 happened to be working less than those from previous years, for reasons not included in the survey? Moreover, it is necessary to take into account the fact that, according to the written reports from the 2019 survey, the unit cost for animation has not increased, making it difficult to reconcile the higher salaries and lower working times. Finally, average data is just that – average. Although we notice the same rising trend for salaries, note how the median numbers are always significantly lower than the mean ones. To put this into perspective, then, it is also necessary to consider how they don’t spread evenly according to each position in the pipeline
In my opinion, the data presented here as a whole is too inconclusive to state whether “working conditions” in the anime industry are getting significantly better or worse. It may be that it was not meant to answer such a question in the first place – as I’ve written above, “working conditions” is something too complex to be entirely understood with statistics.
However, even if there might be improvements on some fronts, the fact remains that working conditions are bad: at least from what is quantifiable, salaries remain low and working hours long. Moreover, it is necessary to put these numbers in perspective with those from the previous post, about studios: many anime studios remain in very difficult positions, and the quality of working conditions probably largely varies depending on each studio, its own state and strategy.
With me finishing this by saying that the data is inconclusive, it might seem like neither this article nor the two previous ones in this series has taught us anything. However, my goal here wasn’t to reach such definitive answers: it was rather to try looking for what data was available, and how it might support or disprove some of our assumptions about the anime industry. If there’s one conclusion to take, then is that reality is complex and that a more general point of view can bring into light many things that on-the-ground perspectives cannot. But they are not contradictory, and I hope they can complement each other even more in the future.
Like our content? Feel free to support us on Ko-Fi!
You might also be interested in
Benoît Chieux, a career in French animation [Carrefour du Cinéma d’Animation 2023]
Aside from the world-famous Annecy Festival, many smaller animation-related events take place in France over the years. One of the most interesting ones is the Carrefour du Cinéma d’Animation (Crossroads of Animation Film), held in Paris in late November. In 2023,...

Directing Mushishi and other spiraling stories – Hiroshi Nagahama and Uki Satake [Panels at Japan Expo Orléans 2023]
Last October, director Hiroshi Nagahama (Mushishi, The Reflection) and voice actress Uki Satake (QT in Space Dandy) were invited to Japan Expo Orléans, an event of a much smaller scale than the main event they organized in Paris. I was offered to host two of his...
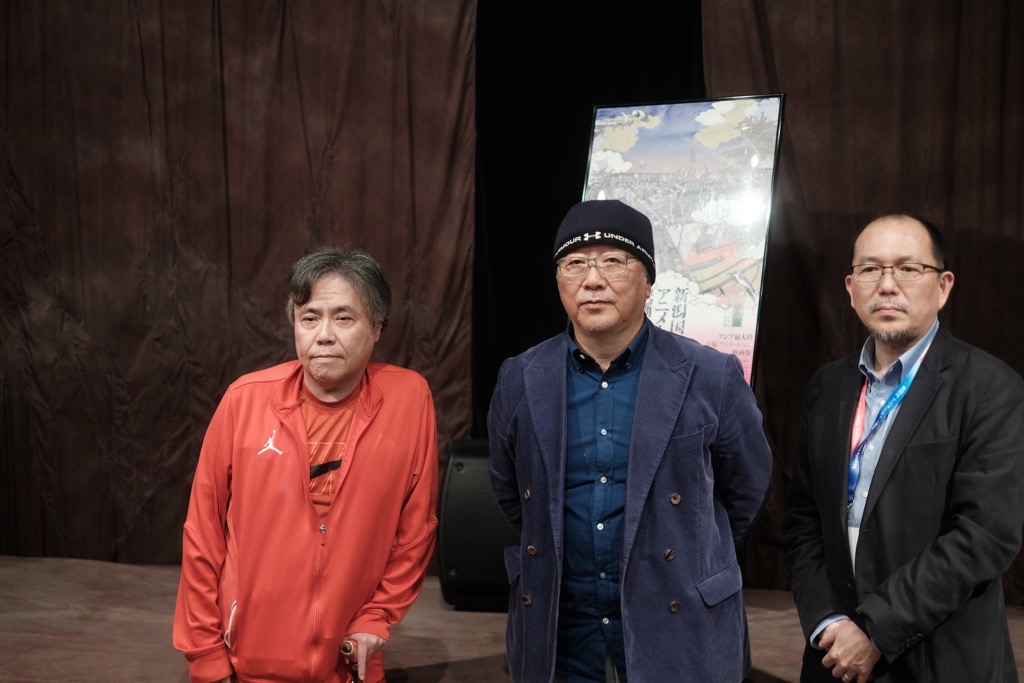
Akira stories – Katsuhiro Otomo and Hiroyuki Kitakubo talk at Niigata International Animation Film Festival 2023
Among the many events taking place during the first Niigata International Animation Film Festival was a Katsuhiro Otomo retrospective, held to celebrate the 45th anniversary of Akira and to accompany the release of Otomo’s Complete Works. All of Otomo’s animated...
Excellent!